Is 7-11 placement related to household income in the Calgary region?
Chad Clark had the following idea and Adam Clark provide the statistical analysis.
Background
I was driving one day when I realized I had seen three 7-11 stores in the
previous couple minutes. It quickly occurred to me that store placement
did not seem evenly distributed around the city. I recalled regions in the
city that did not have any 7-11 nearby.
I found myself a bit puzzled. If I were positioning stores I would want to
have the area served by all stores in a city maximized over as much of the
city as possible. Perhaps store placement was such that it maximizes
coverage over as many of the target customers as possible.
I had previously observed that 7-11's seem to often be placed within a
block of a school. I assumed this is because a sizable portion of the
store's income comes from school-aged children. (I do not know if children
are a significant portion of 7-11's customer base.)
I thought about where I saw many stores and where I saw few stores. I had
a hunch there were more stores in areas with a lower average income. I
asked Adam (a student of geography and statistics) if it were possible to
find out if my hunch were the case.
Implementation
The 7-11 website has a "store locator"
tool that can be used to get a list of the stores in the city of Calgary.
The postal code was taken from each of these street addresses and fed into
a program I wrote to get the
latitude and longitude from a postal code.
Statistics Canada has data available
regarding income. This data contains the mean income for 20% of the
population broken down by different regions in the city. The data is from
the 2001 census.
Results
Adam took care of the statistics part of things. He used ArcGIS 9.1
software to query and map the phenomenon.
He wrote:
There doesn't appear to be any mathematical link between the distances of
the 7-11 stores to all other 7-11 stores (so they're not clustered or
thinly spread out).
and he gave me this image:
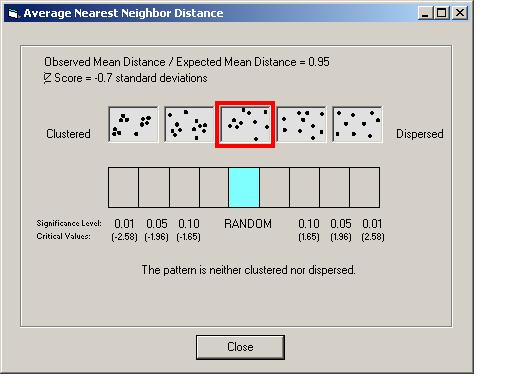
That seems to indicate that the stores are not evenly placed across the
city. Note that this analysis does not consider land use (ie residential,
industrial, park, etc).
The next image he gave me is of the city with each 7-11 store drawn and
regions coloured to represent one of four household income levels. He
comments:
You can look at the average household income though. The different levels
of income are not equal - they're based on [a] statistical separation
rule.
... [T]he thiessen polygons on the map - those are just boxes
drawn around each 7-11 location in such a way that the lines are equally
far from each store.
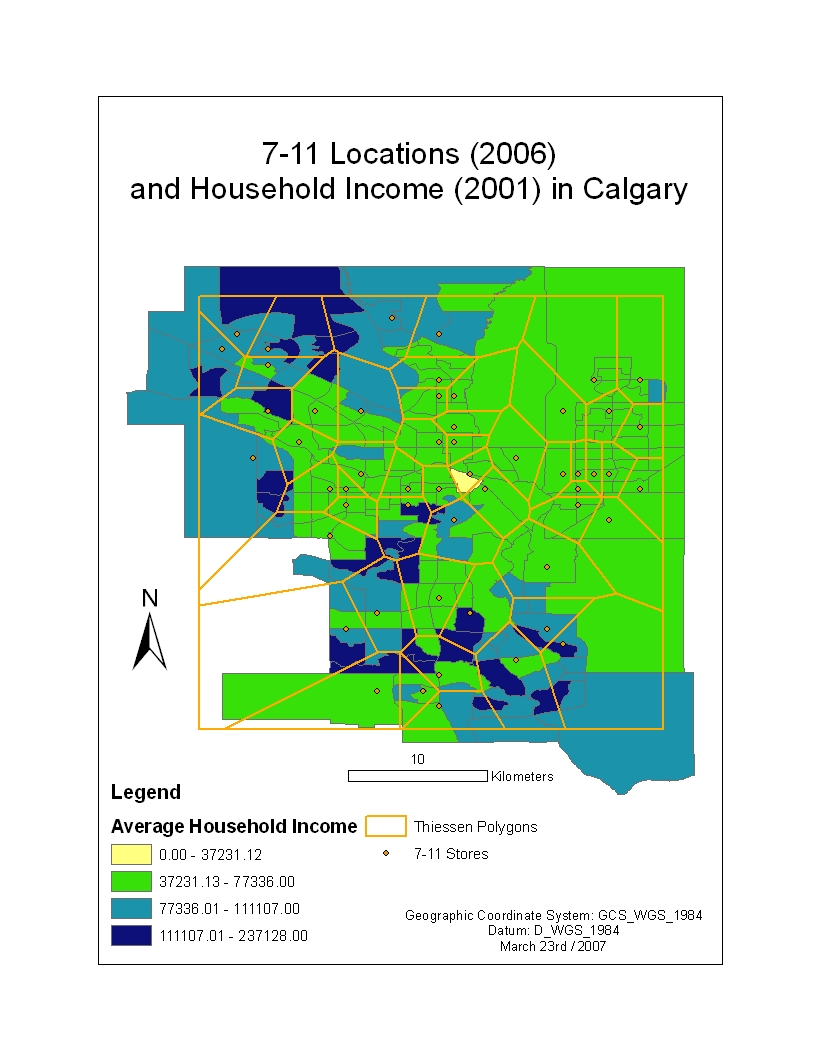
From the image of the city with income levels and store locations it
appears to me that the stores are more densely located in regions average
and below average income levels. This may be coincidence. I imagine it
could be the case that store placement is more dependent on factors like
population density, residential vs industrial land use, and age of the
neighbourhood.
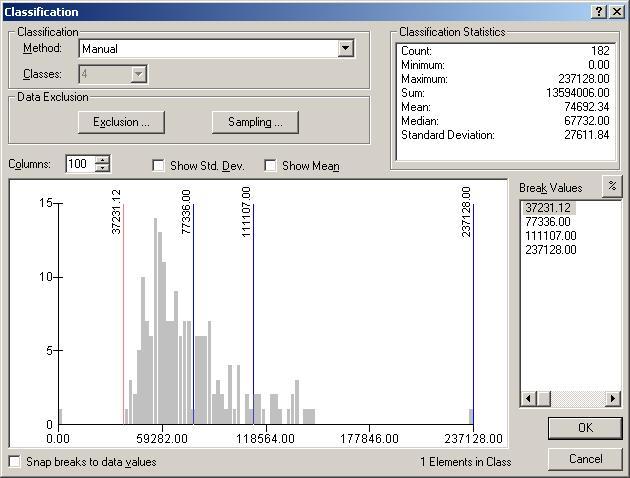
There is an image that deals with the breakdown of income into the four
levels used in the previous image.
He also pointed out that this only touches the surface of considering the
placing of convenience stores with respect to income:
I think with every convenience store in the city, you would see some sort
of clustered grouping of stores in lower end neighbourhoods though. I
would collect convenience store locations for the entire city if it was for
a project or thesis - it would take 2-3 weeks (may have to investigate the
locally owned / family stores to see if they are convenience stores and
maybe take GPS readings for locations that don't show up in phonebook
sources).
Note that most of the income samples seem to fall in the $37k to $77k
income level and that level is where most of the stores seem to be on the
map. It may be worthwhile to try using more income levels. It could also
be worth while to count the number of stores per income level rather than
relying on a visual impression.
Conclusions
Since there are many variables not being considered more work should be done
before drawing conclusion about store location and regional income.
I think it seems fair to conclude that 7-11 store placement is not evenly
dispersed with respect to distance from other stores.
I think my visual impression is of smaller Thiessen Polygons in areas with
average and lower incomes than regions with higher incomes. I have not
attempted to quantitatively determine if such a correlation exists but I
should.
Potential Follow-Up Work
- Factor in land use (residential, industrial, park, etc).
- Factor in population.
- Quantitatively determine if a correlation exists between store
placement and income level.
- Check into development restrictions in neighbourhoods with above
average income.
- Check for a correlation between the ages of neighbourhoods and number
of stores.
- Check for a correlation between the ages of neighbourhoods and income
levels.
- Include convenience-stores other than 7-11.
- Check for a correlation between store placement and school
placement.
- Check for a correlation between store placement and c-train mass
transit.
- Compare Calgary to other cities.